Permian flaring
See basin heat before the print.
For DIY energy investors. Track Permian gas-flaring radiance when night coverage lands, not when the weekly print finally catches up.
Watchlist
1 signal
The problem
Why Permian activity is hard to watch.
Flares move before filings.
Night-time radiance shifts while you wait on EIA-style weekly numbers and operator updates.
Raw fire layers eat the session.
Jumping between FIRMS, Google Earth pads, and forum chatter does not give you a clean time series.
Retail lacks the activity feed.
Specialist energy EO exists for desks. DIY investors get lag, maps, and guesswork.
Aureum's solution
One flare KPI. Less weekly waiting.
Open a basin board each session.
Follow flare activity on Track instead of rebuilding the picture from fire layers and map tabs every session.
Revisit radiance as a KPI.
Track productises VIIRS-backed radiance into a board you can return to, rather than a one-off pad photo tour.
Query the exception when something looks off.
When a county or pad cluster diverges, Query answers the site-level question with evidence.
How it works
Watch the flares. Catch activity early.
Put Permian on the board.
Open the gas-flaring KPI beside other physical-economy Track boards.
Follow radiance drift on Track.
Night coverage updates refresh the activity proxy across sessions.
Query the pad exception.
Ask about a county or facility when a headline needs a ground check.
Follow Permian activity on Track.
A short walkthrough of Track for this job.
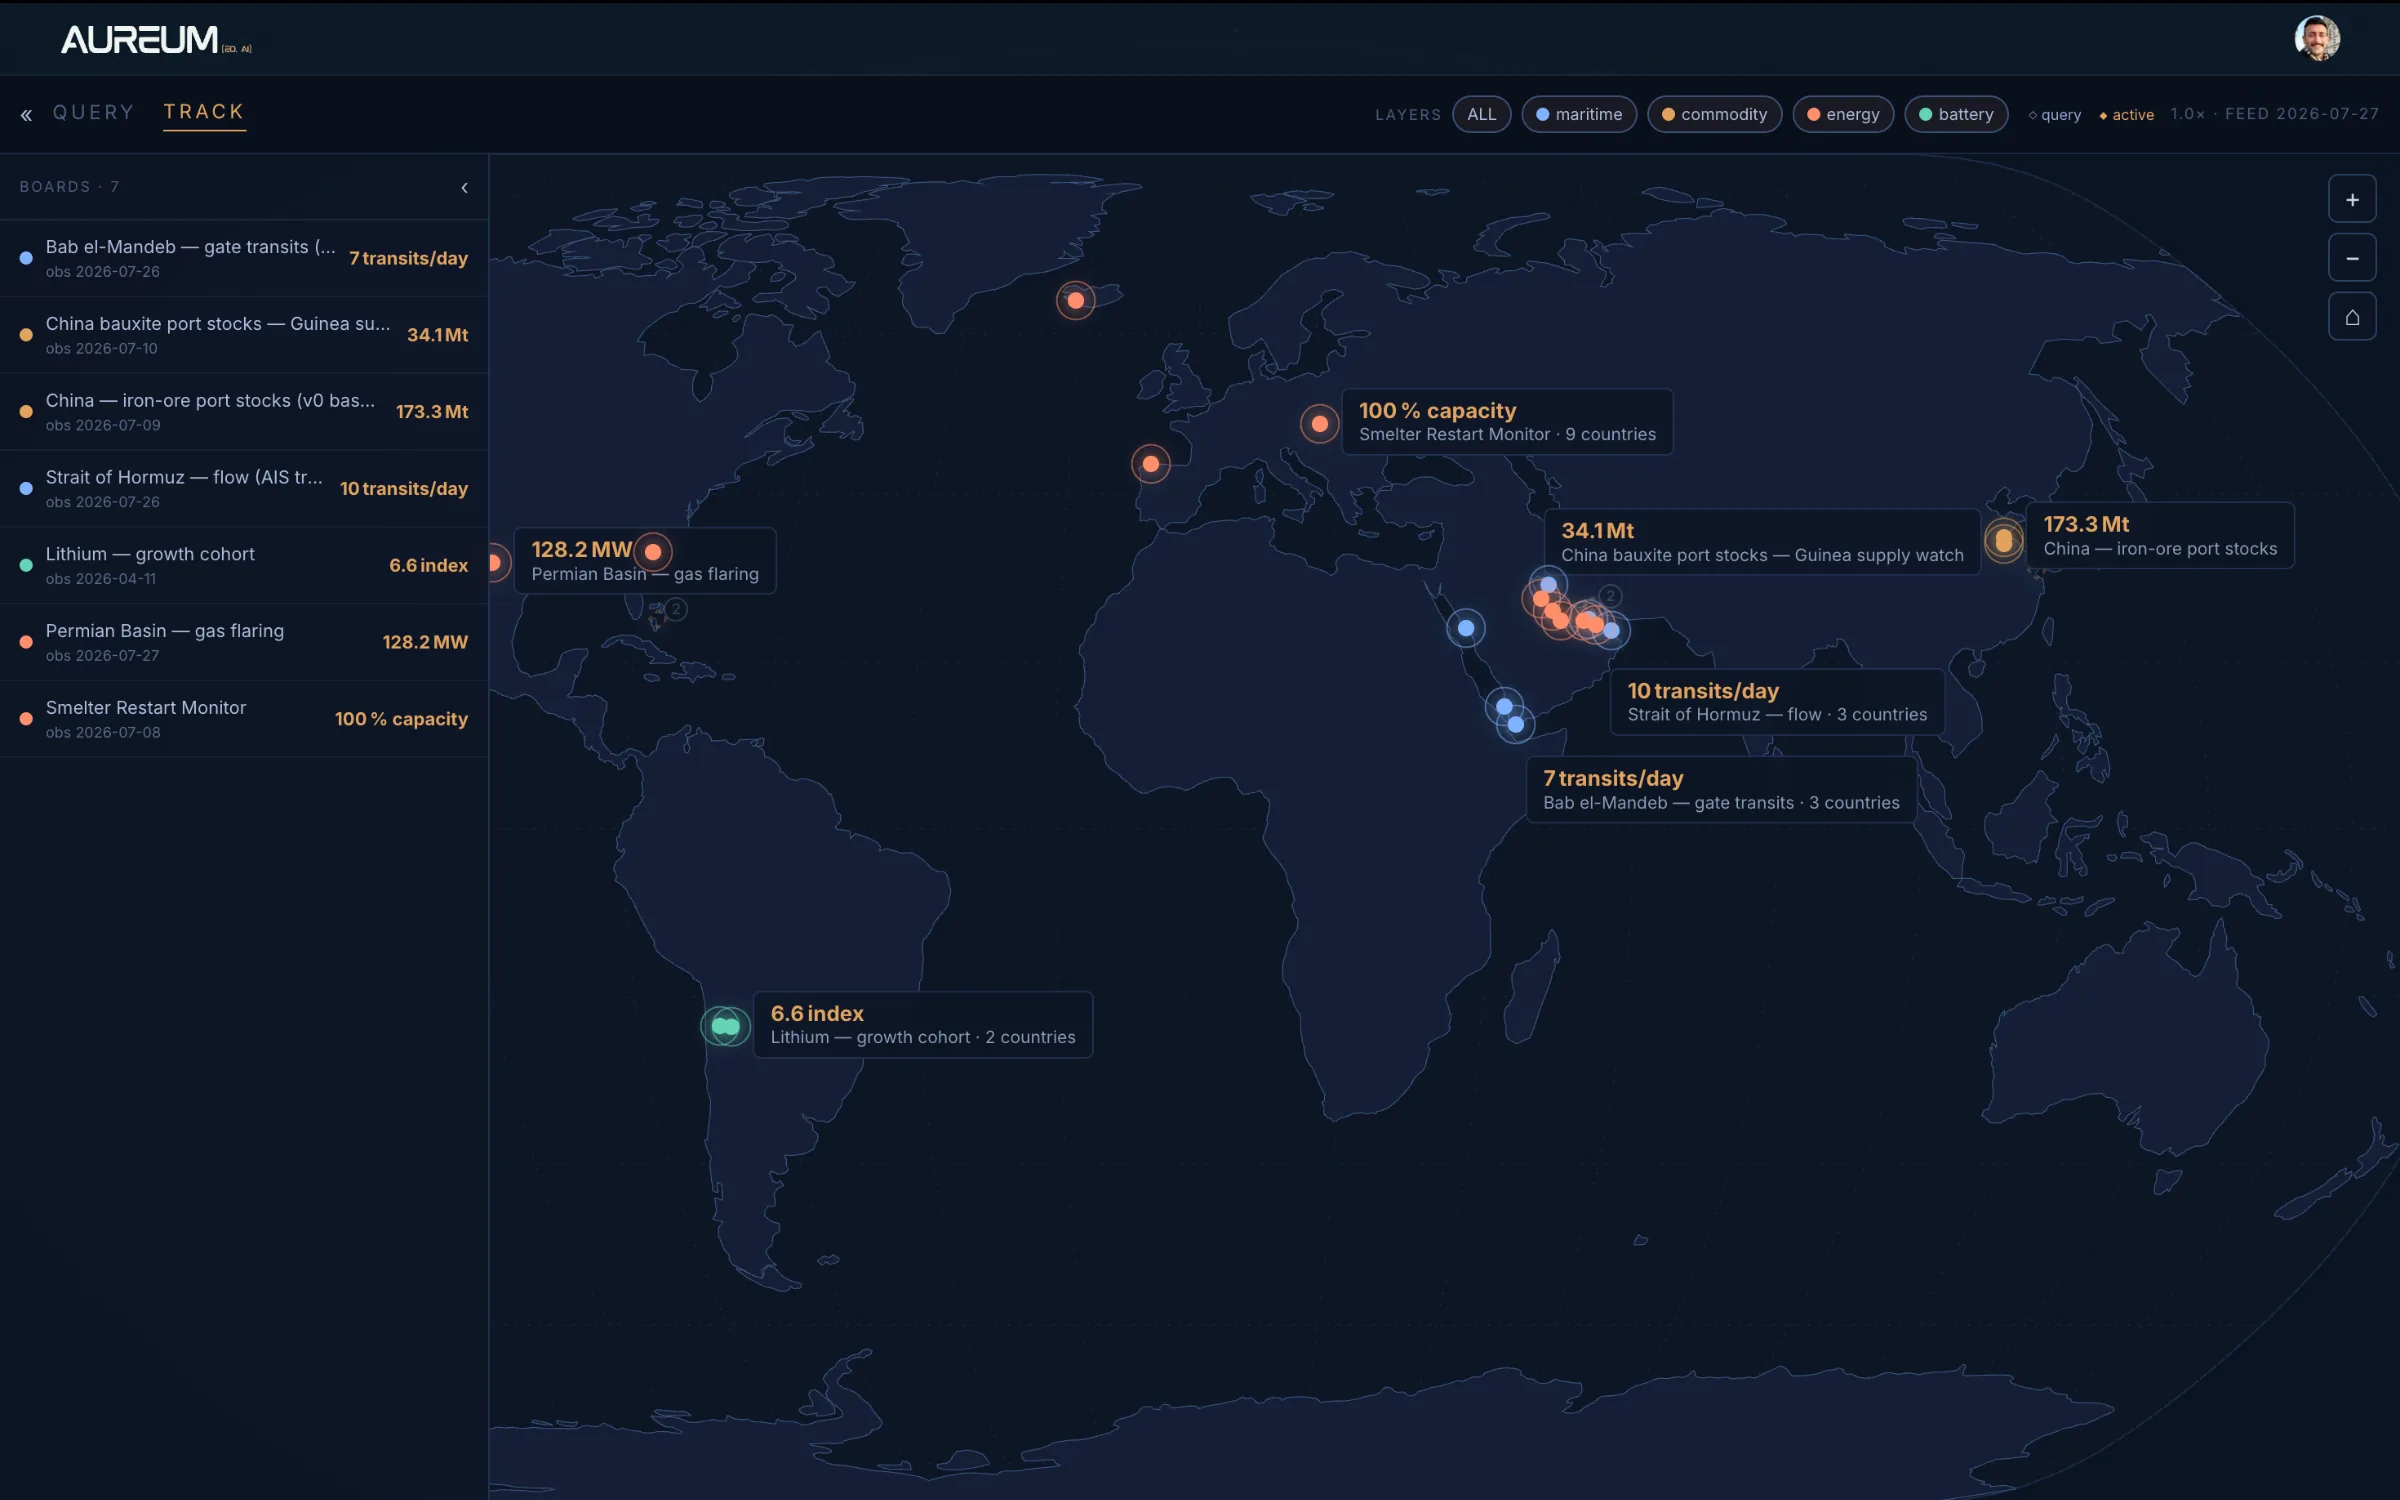
Track.
Hand-built KPI boards on the energy assets that move basin theses.
Use the arrows or the rail below to move through the tour.
Questions DIY energy investors ask
Follow Permian flaring on Track
Beta access to Track KPIs and Query.