News
Hormuz Tanker Transit Slumps: Verifying Crude Bypasses With Satellites
As daily tanker crossings through the Strait of Hormuz collapse to single digits, satellite radar and thermal imagery clarify whether crude is flowing through overland bypass routes or accumulating at regional terminals.
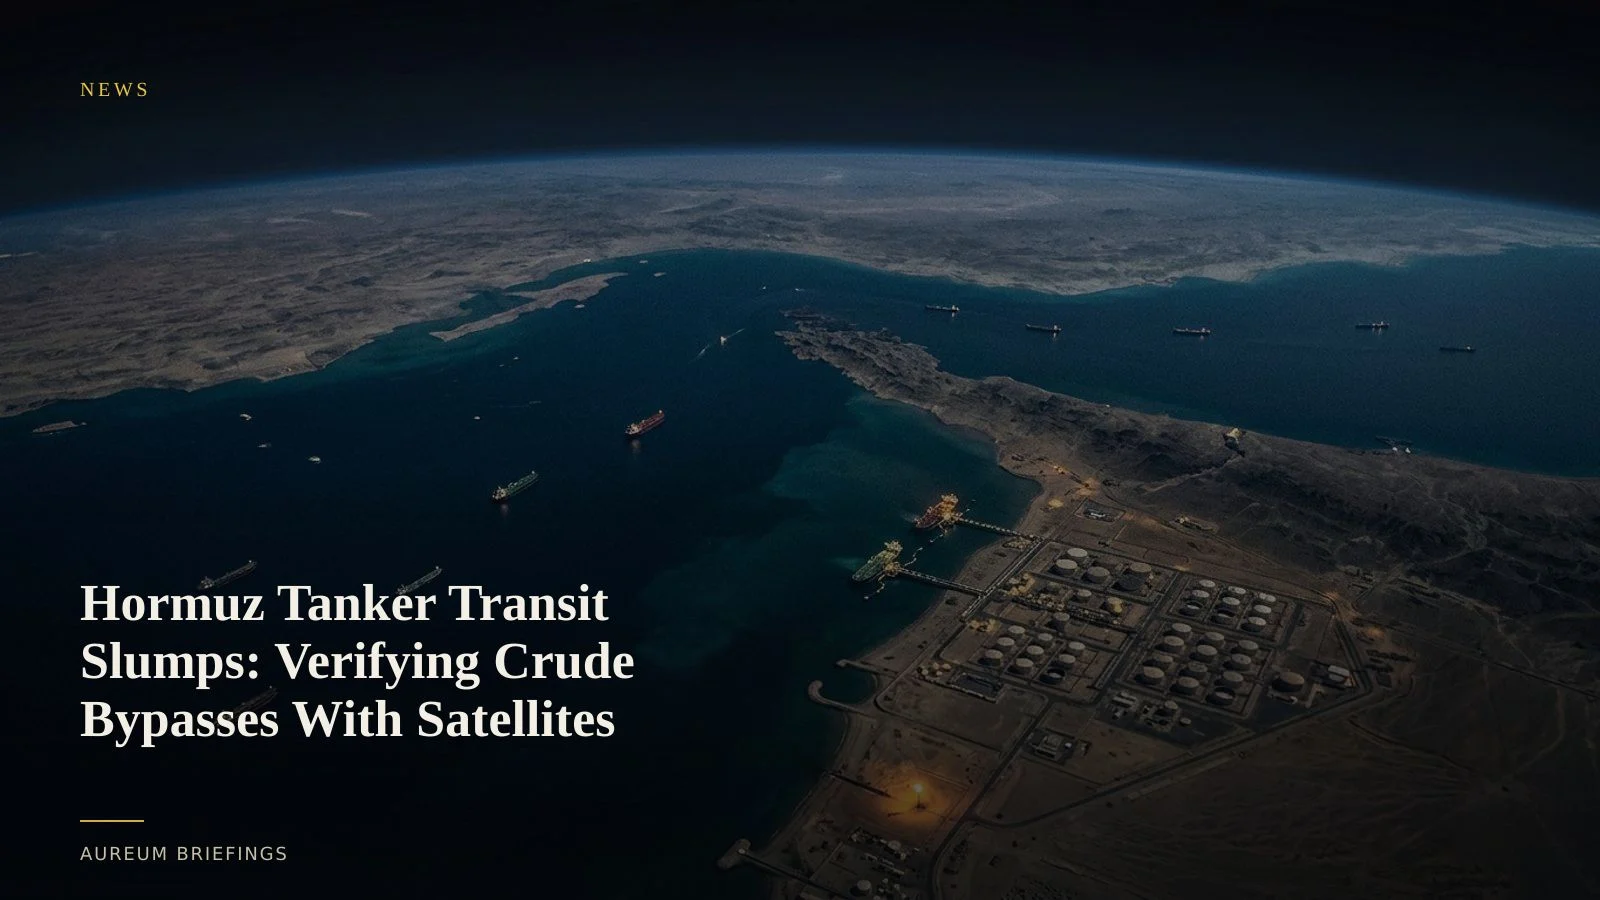
Persian Gulf tanker transit drops to single digits
Vessel movements through the Strait of Hormuz experienced a sharp reduction this week. Ship-tracking figures show Hormuz daily tanker transit dropped to single digits with only five crossings recorded on Wednesday and nine on Thursday, down sharply from the seasonal baseline of roughly twelve daily transits.
While Red Sea flows via the Bab el-Mandeb strait maintained steady double-digit traffic near nineteen carriers daily, Persian Gulf transits have concentrated heavily inside territorial corridors. For energy traders, the immediate challenge is determining whether Gulf crude exports are physically constrained or simply shifting to overland bypass infrastructure.
Verifying overland bypass pipelines and East Coast terminals
Policy analysts point out that regional producer states have spent years constructing structural efforts to bypass Middle Eastern chokepoints. Pipelines like Abu Dhabi's crude line to Fujairah and Saudi Arabia's East-West pipeline to Yanbu on the Red Sea allow crude to circumvent Hormuz entirely.
However, official throughput numbers for these bypass pipelines lag by weeks. Without direct physical verification, traders cannot confirm whether pump stations are running at maximum capacity or whether crude is building up inside upstream storage tanks.
How satellite radar cuts through vessel dark tracking
When tankers alter transponder signatures or turn AIS transponders off in disputed corridors, optical imagery can be hampered by coastal hazes. Spaceborne Synthetic Aperture Radar from platforms such as ESA Copernicus Sentinel-1 provides clear structural detection of vessel hulls regardless of weather or cloud cover.
While institutions rely on Ursa Space crude storage analytics and expensive institutional feeds, individual investors can track physical changes across key Gulf transit zones directly.
By comparing radar reflections at Fujairah anchorages against baseline signatures, traders verify whether anchored crude carriers are waiting to load bypass crude or remaining idle outside the gulf.
Measuring tank roof levels at Fujairah and Yanbu
Beyond vessel counts, measuring floating-roof tank shadows at export terminals provides physical confirmation of inventory drawdowns. High tank roofs indicate heavy accumulation, while lower roofs confirm active loading onto outbound tankers.
When combined with thermal flaring observation across upstream processing facilities, satellite analysis confirms whether production is being throttled or redirected into bypass networks.
Decision process for energy traders
Traders without an institutional research desk frequently face conflicting commentary when chokepoint headlines break. Relying solely on headline news risks trading on outdated information.
A structured workflow combines headline tracking with satellite-backed verification. Use Track to follow hand-built KPI boards on chokepoint corridors, or use Query to ask targeted questions about terminal storage and anchorage density before weekly inventory prints publish.
Follow physical energy flows
Private beta is open. Follow hand-built Track boards on maritime chokepoints or query specific terminal sites with satellite evidence.