News
Global Supply Chain Stress Spikes: Tracking Downstream Inventory Buffers With Satellites
As shipping disruptions drive global supply-chain stress toward multi-year highs, physical energy markets face a delayed unwinding. Here is how satellite observation tracks downstream storage buffers before official statistics print.
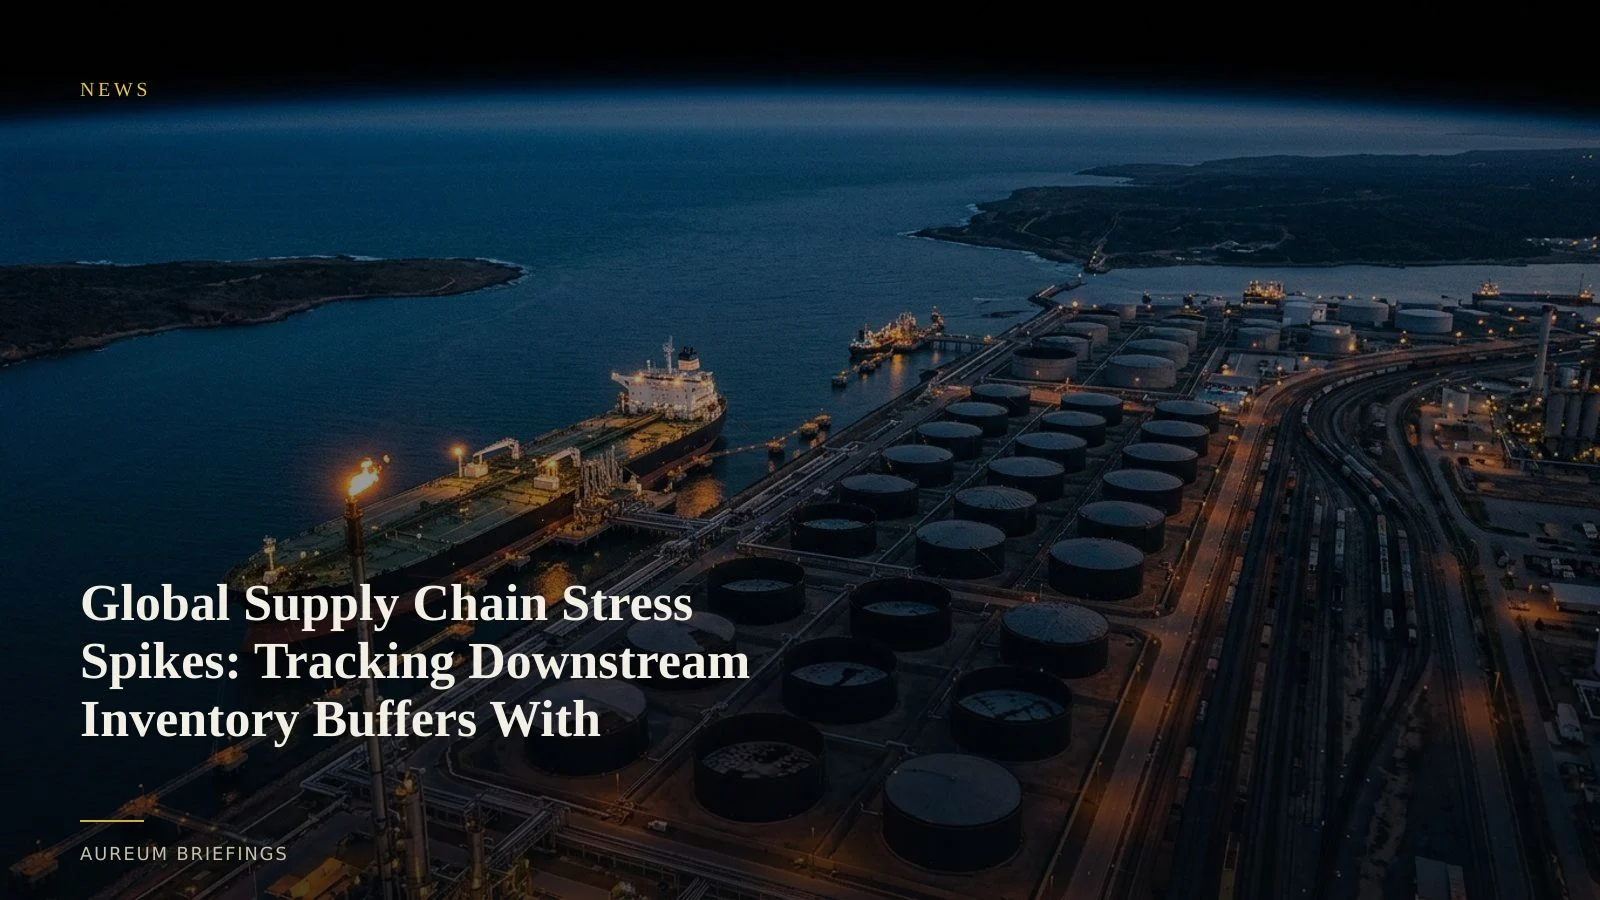
Diplomatic progress lags physical supply chain realities
Even as preliminary negotiations suggest diplomatic progress along key maritime chokepoints, global supply-chain indices remain near their highest levels since the post-pandemic recovery. Recent maritime shipping analytics confirm that transit bottlenecks and extended rerouting continue to delay crude and refined product deliveries to major consumption hubs.
While benchmark futures react quickly to political headlines, physical trade flows adjust far more slowly. The true friction sits in downstream inventory buffers, where import terminals and regional storage farms must absorb delivery delays or draw down reserve stocks to maintain refinery runs.
Why official inventory prints create a delayed signal
Traders relying solely on official data feeds often face significant time lags. Standard reporting from the EIA weekly crude petroleum status or customs disclosures can lag physical inventory shifts by days or weeks.
During high-volatility periods, a market pricing in immediate normalisation can be caught unprepared if downstream storage tanks are already drawn down to critical thresholds. Verifying tank floating-roof levels and terminal fill rates visually eliminates this reporting lag.
Measuring storage tanks with optical and synthetic aperture radar
Satellites provide direct measurement of liquid storage levels across floating-roof tank farms. Sun-glint optical imagery captured by European satellite constellations allows geometric shadow analysis, calculating internal roof depression to estimate exact volume.
When cloud cover obscures optical sensors, synthetic aperture radar (SAR) penetrates overcast skies to bounce signals off tank walls and metallic roof structures. This dual-sensor approach provides regular volume updates, giving traders clear visibility into whether import terminals are drawing down reserves or accumulating emergency buffers.
Connecting port staging to inventory drawdowns
Storage draws rarely happen in isolation. When ocean transit times lengthen, container freight rates spike across container shipping benchmarks, and tankers linger at offshore anchorages.
By pairing vessel transit delays with visual monitoring of terminal tank farms, traders can distinguish between temporary vessel queueing and structural inventory shortfalls. Physical ground truth replaces speculative headlines.
How retail traders build a satellite-backed edge
Historically, satellite-derived inventory intelligence was restricted to institutional trading desks with large analytical budgets. Independent traders were left waiting for public releases or unverified commentary on social feeds.
Aureum bridges this gap by turning complex orbital observation into plain-English questions and structured tracking. You can ask Query about specific facility inventory levels or follow hand-built Track boards to observe critical physical economy nodes as market events unfold.
Run the workflow yourself
Private beta is open. Ask Earth a question with Query or follow hand-built KPI boards on named sites with Track.